
I love to get stuck in and let the creative juices flow. My strengths lie in idea generation, development and execution. Over 5 years experience in B2B cybersecurity. I reign supreme when my imagination and creativity can run wild.

Cyber security is now a major focus for organizations of all sizes and across all industries. Despite the increased attention on cyber—and corresponding boost in budgets—many organizations still struggle to effectively measure and report on their cyber program. This challenge has broader implications, as justifying your budget and headcount is much more difficult if you can’t clearly show results and success to the board.
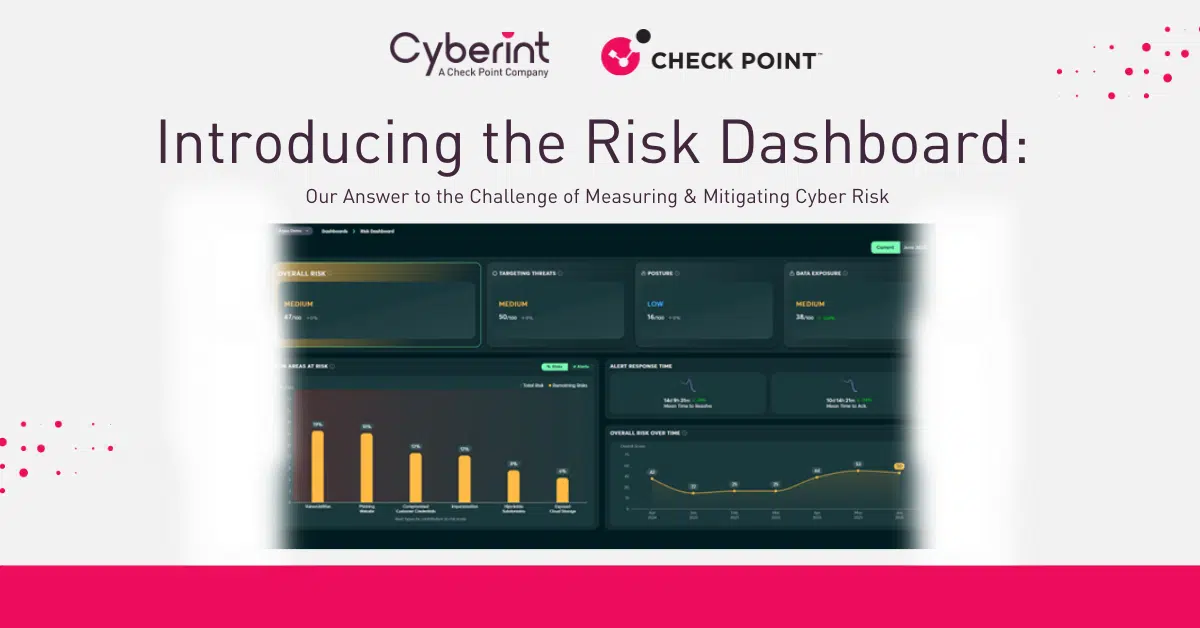
To help security leaders address this challenge, the Cyberint, now a Check Point Company team is delighted to announce the new Risk Dashboard. The purpose of the risk dashboard is to facilitate meaningful discussions with executives and help senior cybersecurity leaders demonstrate that their cyber program is effectively reducing risk to the organization’s core operations.
In this blog post, we’ll explore our approach to measuring risk and discuss how these metrics enable CISOs and other security leaders to demonstrate their results to the board.
The main objective of a cyber security program is to safeguard the confidentiality, integrity, and availability of the organization’s IT systems and data. However, when reporting to executive leadership teams, it’s not enough to report that no major breaches occurred. Executives are demanding increased scrutiny on cyber security programs and want to know whether or not their organization is secure.
An effective way to broach this discussion is to talk about risk. Of course, the trouble with risk is that it cannot be easily measured in the same way that you can measure the dimensions of a piece of furniture or the weight of an object.
A common approach is a simple two-dimensional assessment based on the probability of an event (e.g. an endpoint is infected with advanced malware that bypasses the EDR) and the impact of that event, should it occur (e.g. exfiltration of sensitive data, potentially leading to extortion and compliance challenges).
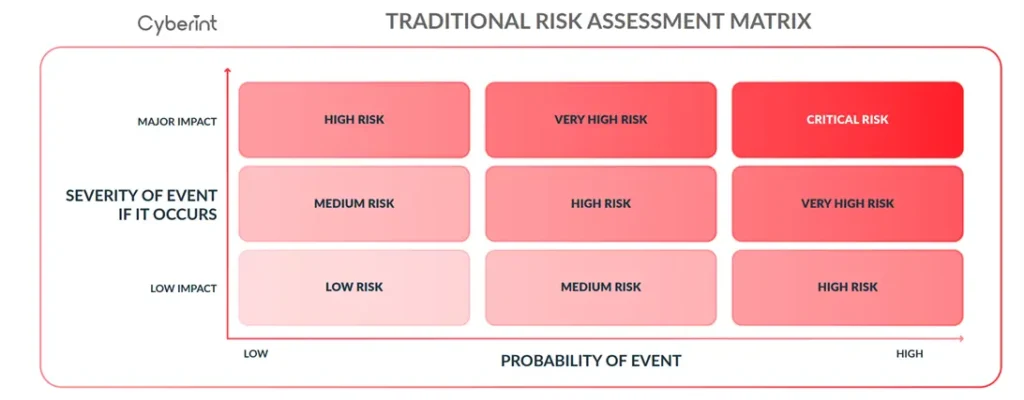
This approach is insufficient for something as complex as a cyber security program. There are too many variables and not enough data to reliably estimate the probability or impact of a specific event.
Let’s drill down on the challenges with quantifying the probability of an event with the help of an example.
Suppose we know the exact number of ransomware events that occur in a specific industry and region. Suppose further that we know the total number of companies that operate in that given industry and region, allowing us to calculate a simple percentage of companies that fell victim to a ransomware attack in a given timeframe. Let’s say it’s 2% per annum. Does that mean that every organization in that region and industry has a 2% chance of suffering a ransomware attack?
Of course not. The real probability will depend on an array of other factors, such as the size of the organization’s digital footprint, the number of security controls they have in place to protect Internet-facing assets, their level of cyber hygiene, the amount of investment into cybersecurity, the quality and number of cyber solutions they have deployed, the number of people on their cybersecurity team, and so on. Some organizations may have a 20% probability (1 in 5) of experiencing a ransomware incident, while others with a mature cyber program may have only a 0.0002% (1 in 5,000) chance. Because we lack relevant data on these other important variables, we cannot estimate probability with any degree of accuracy.
None of this is to say that measuring risk isn’t important—it most certainly is! But modern cyber programs call for a more sophisticated approach than a simple, two-dimensional risk matrix.
There are many commercial off the shelf cyber security products available and most, if not all, provide a risk score. Each score will take a different range of data into account, based on the type of solution in question. Security leaders should carefully select the risk scores that are most valuable for their own organization and its unique circumstance.
Taking a broader look at cyber security risk, there are several factors that are more significant than the specific details of any single score. Those factors are:
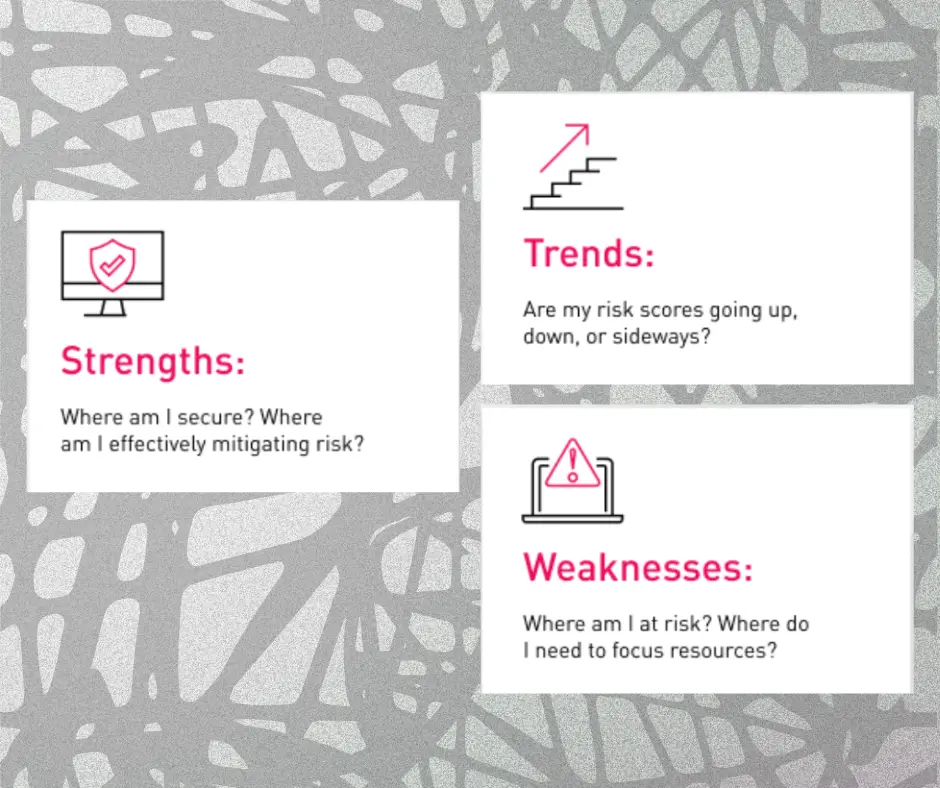
Trends are essential because a good score is only “good” if it was “average” in the past. If you have a good score but it used to be “great,” then something is off. The same dynamic is true for “average” scores that used to be “poor”—while nobody strives to be average, demonstrating progress in the right direction is critical.
Strengths and weaknesses play an important role too. CISOs and other senior security leaders need to understand what’s going well—that is, what they should continue doing—and what isn’t working, so that the appropriate adjustments can be made. If email security is, in fact, very strong and in the 92nd percentile, then there’s no reason to make additional investments in email security. But it’s also a good reason to continue investing in whatever technologies and processes are in place.
On the other hand, identifying areas for improvement is an indispensable part of risk management. Once high risk areas are identified, the risk can be properly communicated, along with options for handling the risk. In some cases, potential solutions may be deemed too complex or costly to deploy and the board may decide to simply accept the risk. This is also a reasonable course of action—as long as the level of risk, potential consequences, and risk management options have been accurately reported, the security leader’s job is done.
The Risk Dashboard assigns 4 distinct scores: an overall risk score, target level score, posture risk score, and data exposure score. It also gives security teams an easy way to view trends for each score, and identify strengths and weaknesses.
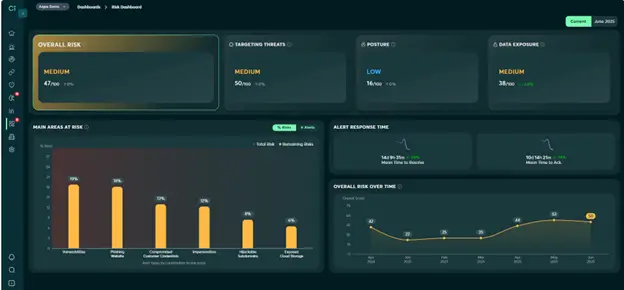

The Overall Risk Score quantifies the level of external cyber risk for a particular environment. Since this number represents risk, a low score is good and a high score is bad. The lower the overall risk score, the higher the security of that organization and the lower the likelihood of a major security incident.

The Target Level is a measure of how targeted an organization is by threat actors. To put it simply, it reflects how hard cyber criminals are trying to attack your organization. This category looks at dark web chatter, phishing campaigns targeting you, impersonation of your brand on social media platforms, malicious mobile applications masquerading as your official apps, and other factors. While you can’t necessarily prevent threat actors from targeting you, it’s essential to know how highly targeted you are.
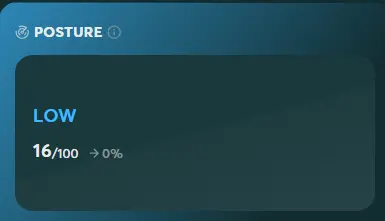
The Posture Risk Score is a measure of an organization’s security posture and hygiene, from an external perspective. This score considers things like open ports, outdated and unpatched software, DNS misconfigurations, expired SSL certificates, exposed web interfaces, exposed cloud storage, and more. While not all of these issues represent major risks, they all indicate the level of attention an organization gives to keeping its Internet-facing assets protected and following cybersecurity best practices.

The Data Exposure score is a measure of how exposed an organization’s data and credentials are across the web. This takes into account things such as source code leakage, API key exposure, dumped PII, leakage of internal business data or intellectual property, data leaks caused by third-party data breaches, and more.
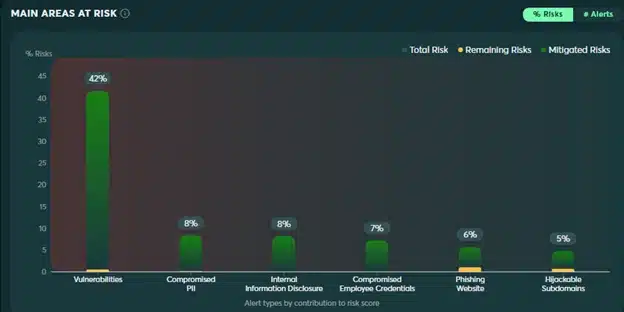
In the above widgets, customers receive a summary of the risks they currently face as well as the risks they have successfully mitigated. There is also a widget to clearly display trends, as measured by the 4 risk scores described above. This makes it easy to understand what risks are being effectively managed, what challenges must be addressed, and which way the various risk scores have been trending over time.

The risk benchmark shows how well you are doing against your peers. It is based on a percentile as compared to peer organizations so, for example, a score of 75 means that the environment has a lower level of external cyber risk than 75% of other organisations in the same industry or region.
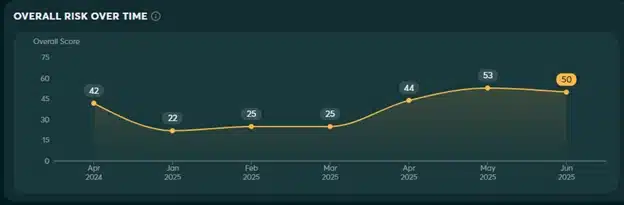
As mentioned before tracking cyber security risk over time is curious. If you see a drop for example you would want to continue the current program and continue to see improvement. If there is a sudden peak however you would want to investigate and potentially alter your strategy.
Demonstrating cyber success is crucial for securing organizational buy-in and resources. While quantifying risk remains challenging, focusing on key metrics, effective communication, and strategic risk mitigation can help. By leveraging tools like the Cyberint risk dashboard, organizations can gain valuable insights into their security posture, identify areas for improvement, and make data-driven decisions to strengthen their defenses. To learn more about how the Cyberint risk dashboard can benefit your organization, contact us for a demo today.