The Power of an AI-Driven Bot Introduction
When it comes to SaaS operation, the ability to respond swiftly to technical glitches and potential failures can mean the difference between a minor hiccup and a full-blown crisis. At Cyberint, we’re always on the lookout for out-of-the-box solutions to enhance our operational efficiency and ensure the highest level of service reliability. It’s with this spirit of innovation that we’ve embraced OpenAI’s Assistant to revolutionize the way our on-call engineers interact with and respond to our production environment critical alerts.
The Challenge
Our production environment is a complex distributed ecosystem where numerous monitoring systems, among them Grafana and Prometheus, continuously generate alerts. These alerts range from Kubernetes cluster issues, such as a crashed pod, to more systemic problems affecting our SaaS system or applicative flows. Additionally, we monitor infrastructure, including Kafka lags, SQS bottlenecks, and many more.
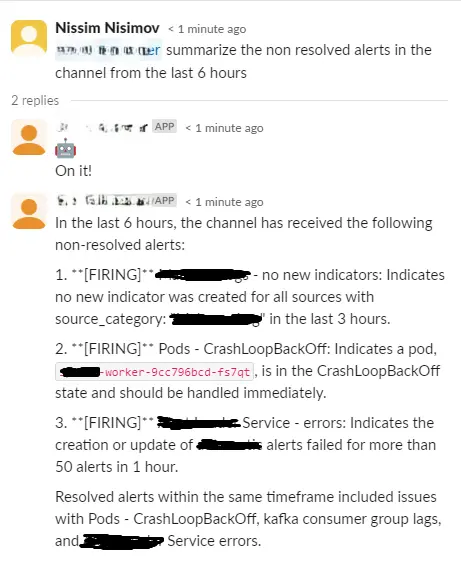
In addition, the volume and variety of these alerts present a significant challenge. keeping track of which alerts are still open and which have been resolved can be a challenging task for our engineers who must quickly diagnose and respond to incidents.
The Solution: An AI-Powered On-Call Assistant
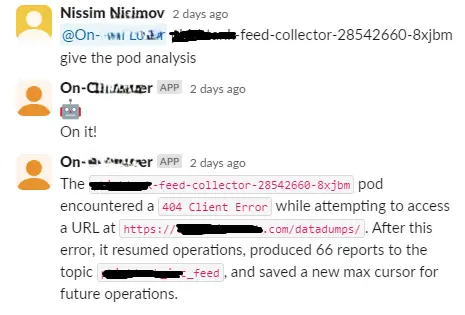
To address these challenges, we’ve developed an AI-powered bot assistant, leveraging the OpenAI Assistant, designed specifically for our on-call engineers. This bot assistant represents a paradigm shift in how we monitor and respond to production critical alerts. It acts as a bridge between our engineers and the alerts in our Slack channel, which gathers notifications from various monitoring tools.
Key Features and Functionalities
- Centralized Alert Monitoring: The bot connects to our critical alerts Slack channel, serving as a central point for alerts from Grafana, Prometheus, and other tools.
- Intelligent Query Handling: It can understand and respond to queries about each alert, simulating human-like analysis to suggest the appropriate action to take.
- Dynamic Function Triggering: Depending on the alert, the bot decides which function to trigger and with what parameters, streamlining the response process.
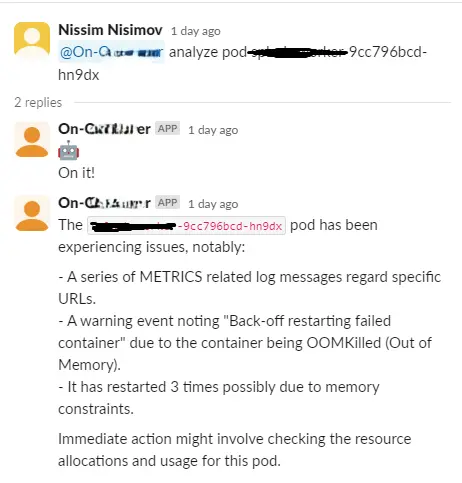
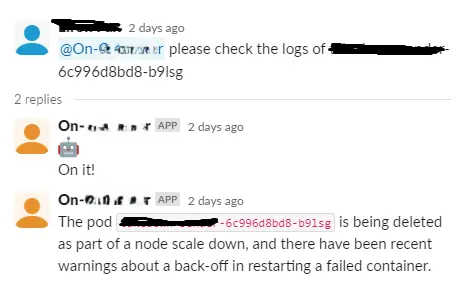
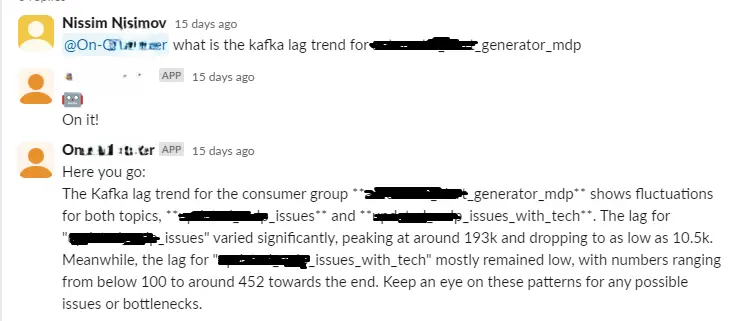
- Advanced Troubleshooting Capabilities: For instance, it can fetch the relevant Grafana dashboard to analyze trends in Kafka lag, obtain Kubernetes descriptions and pod logs to diagnose crashes, and identify out-of-memory (OOM) issues by examining pod termination states.